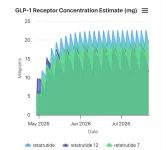
The peaks and dips on apps or glp plotter are mostly useful to get an idea of what drug levels are doing over time, so you can see that peaks are usually about 24h after a dose, and that repeated doses will build up the valleys and peaks over 4 weeks or so, and the real use is to see how that corresponds to side effects. As you can plug in different doses and timings and see what the levels look like, which is useful once you know what side effects happen at what levels. GLP drugs have very different half lives to just about every other drug, so seeing what it looks like on a graph helps to understand what is going on.
But mainly you have to go by feel, it is what matters. If what you are taking is causing side effects, then you need to reduce doses or sometimes split doses instead, and if you are hungry , increase doses. There is so much individual variation in side effects and response to the drugs that your actual effects from them are what matter in the end anyway. The graphs are just an abstraction , a general estimate rather than actual levels, but can be useful to work out doses or timing of doses if you are going to dose more often than once a week.