keangkong
GLP-1 Specialist
- Member Since
- Sep 2, 2024
- Posts
- 1,975
- Likes Received
- 5,478
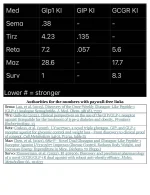
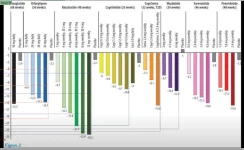
I saw a chart repeatedly showing the supposed potencies of different weight loss drugs in humans. I assumed that the information in it was wrong, but when I checked, everything matched scholarly sources.
The profiled drugs are semaglutide, tirzepatide, retatrutide, mazdutide, and survodutide.
I realize that there are caveats I should be adding on using the data but I'm so inexpert in this field that I can't even explain well the reason for the caveats.
I'm adding an image of the chart along with sources. I'm also attaching a .pdf document, which will permit you to click on the hyperlinks in order to access the source documents without having to go through a paywall.